EURJPY Price Faces Critical Resistance Level
EURJPY Price Analysis – July 17 In the immediate area surrounding the EMAs, there is a solid support level of…
EURJPY Price Analysis – July 17
In the immediate area surrounding the EMAs, there is a solid support level of $121. In case the mentioned level is broken it should lead the momentum to the previous low of $120 and $119. On the flip side, should the support level of $121 continue to hold, then, a rally may form and to confirm, the daily candle must close above the resistance level of $122, this may lead to the testing of $123 level
EURJPY Market
Key Levels:
Supply levels: $122, $123, $124
Demand levels: $121, $120, $119
EURJPY Long-term Trend: Ranging
EURJPY is range-bound for now on the long-term outlook. EURJPY was seldom increasing in price last week. The buyers were gradually controlling the market and the resistance level of $121 was penetrated by the buyers’ pressure. Later this week, the pair enters into a confinement zone when a resistance level of $122 holds the price. The level was tested three good times. The confinement in EURJPY will soon further the trend higher or try to reverse the course to the down-side. Like all ranges, it will not last forever but rather break out.
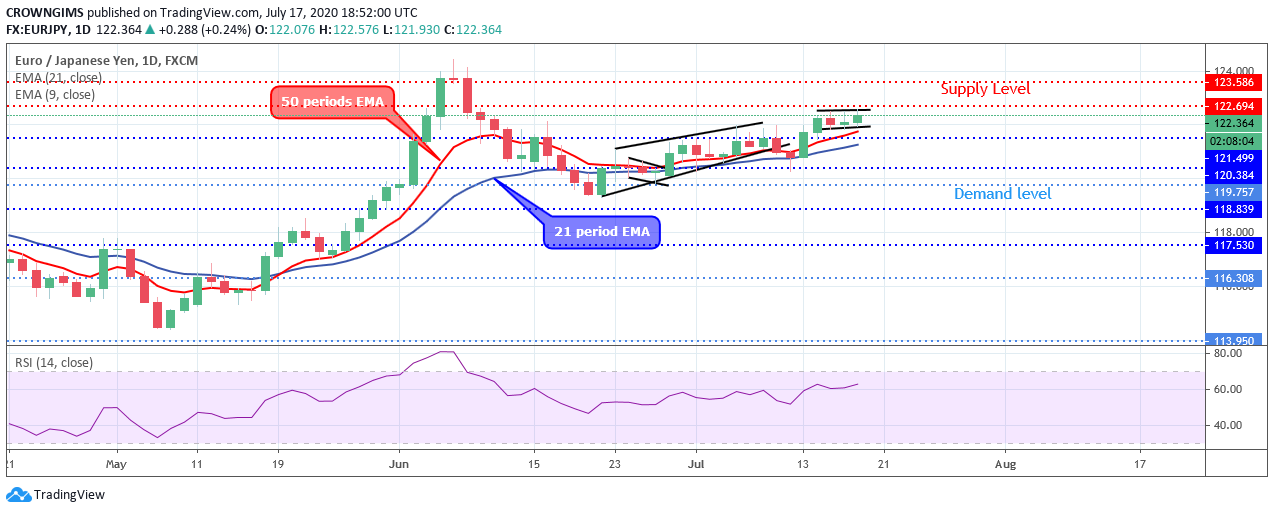
In the immediate area surrounding the EMAs, there is a solid support level of $121. In case the mentioned level is broken it should lead the momentum to the previous low of $120 and $119. On the flip side, should the support level of $121 continue to hold, then, a rally may form, and to confirm, the daily candle must close above the resistance level of $122, this may lead to the testing of $123 level. The bending up of the Relative Strength Index period 14 indicates a buy signal.
EURJPY medium-term Trend: Ranging
The currency pair enters a range-bound zone on the 4-hour chart. A closer look at the EURJPY market on the medium-term shows that the pair is confronted with a significant resistance level. The level has been tested three good times. The breakout is imminent to the north or south.
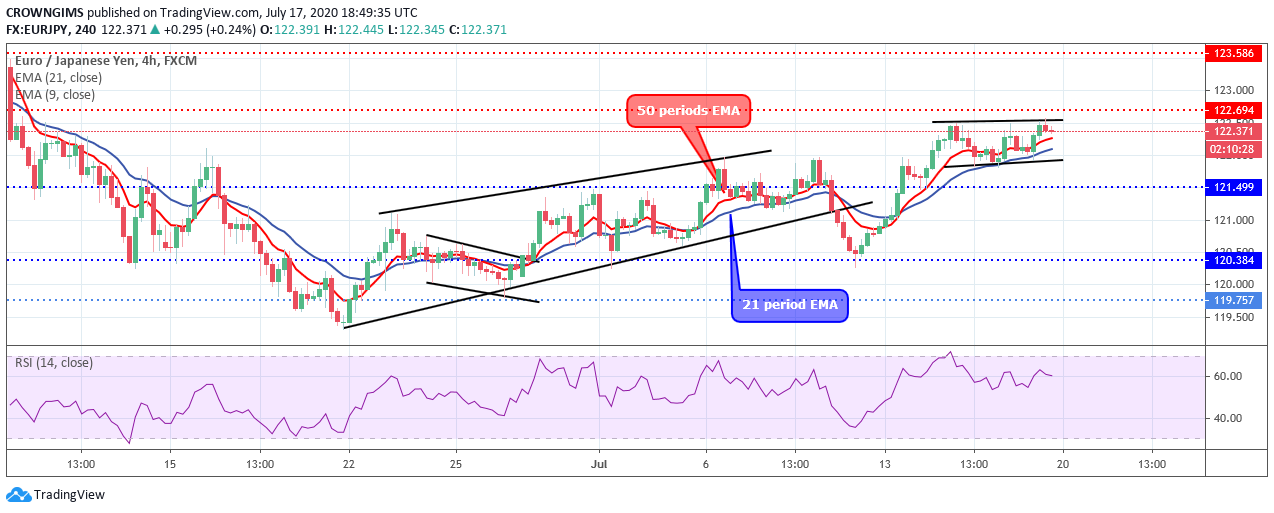
The 9 periods EMA and the 21periods EMA display a bullish signal as it rises and the price trading above it. The relative strength index period 14 is at 60 levels with the signal line bending downside to indicate the sell signal.


Comments